Exercises: Part III#
We are going to read in some real data again and do some simple plots and analysis. Let’s take a look at a monthly sea ice extent time series from the National Snow and Ice Data Center. Sea ice extent is measured in 10\(^6\) km\(^2\). You can download your own copy of the .csv file here.
The data consists of 3 columns: year, month and extent.
Follow along in your own jupyter notebook.
First, let’s load in NumPy and Matplotlib. See if you can remember the syntax without peeking :)
Show code cell source
# Import packages
import numpy as np
from matplotlib import pyplot as plt
Next, we will load in the data. To load in .csv files in NumPy, we can use the np.genfromtxt() function.
# Load Arctic sea ice data
ice = np.genfromtxt('ice_month.csv',delimiter=',')
I always like to take a look at my data before I do anything else. So, let’s take a look at the shape. Type out how you would find the shape of ice.
Show code cell source
# shape of ice
ice.shape
Show code cell output
(531, 3)
What does the shape tell you about the data? What do the two dimensions represent?
Introducing Datetime (Bonus section)#
A date in Python is not a data type of its own, but the datetime package allows us to work with dates as datetime objects. Let’s take a look at how it works in order to convert the year and month information that we have to a datetime object.
Let’s extract the year and month from our array, ice.
Note that to convert to a datetime object, the data type must be integer - so we will do a type conversion.
Try to extract the year and month data on your own by slicing the ice array. Use the np.astype() funtion to convert the data type to integer. Click to reveal if you get stuck.
Show code cell source
# time components
year = ice[:,0].astype('int') # use .astype to convert the data type of an entire array
month = ice[:,1].astype('int')

# sea ice extent
SIE = ice[:,2]
Now, we will import the datetime package and create our datetime object.
import datetime

# loop over the elements of our time components
time = np.empty((ice.shape[0]),dtype='datetime64[M]') # M is for monthly data
for i in range(ice.shape[0]):
    # to create a datetime object we list things in order of year, month, day, hour, minute, second, etc.
    time[i] = datetime.datetime(year[i],month[i],day=1) # we use day=1 just as a place-holder
print(time[:])
Show code cell output
['1978-10' '1978-11' '1978-12' '1979-01' '1979-02' '1979-03' '1979-04'
 '1979-05' '1979-06' '1979-07' '1979-08' '1979-09' '1979-10' '1979-11'
 '1979-12' '1980-01' '1980-02' '1980-03' '1980-04' '1980-05' '1980-06'
 '1980-07' '1980-08' '1980-09' '1980-10' '1980-11' '1980-12' '1981-01'
 '1981-02' '1981-03' '1981-04' '1981-05' '1981-06' '1981-07' '1981-08'
 '1981-09' '1981-10' '1981-11' '1981-12' '1982-01' '1982-02' '1982-03'
 '1982-04' '1982-05' '1982-06' '1982-07' '1982-08' '1982-09' '1982-10'
 '1982-11' '1982-12' '1983-01' '1983-02' '1983-03' '1983-04' '1983-05'
 '1983-06' '1983-07' '1983-08' '1983-09' '1983-10' '1983-11' '1983-12'
 '1984-01' '1984-02' '1984-03' '1984-04' '1984-05' '1984-06' '1984-07'
 '1984-08' '1984-09' '1984-10' '1984-11' '1984-12' '1985-01' '1985-02'
 '1985-03' '1985-04' '1985-05' '1985-06' '1985-07' '1985-08' '1985-09'
 '1985-10' '1985-11' '1985-12' '1986-01' '1986-02' '1986-03' '1986-04'
 '1986-05' '1986-06' '1986-07' '1986-08' '1986-09' '1986-10' '1986-11'
 '1986-12' '1987-01' '1987-02' '1987-03' '1987-04' '1987-05' '1987-06'
 '1987-07' '1987-08' '1987-09' '1987-10' '1987-11' '1987-12' '1988-01'
 '1988-02' '1988-03' '1988-04' '1988-05' '1988-06' '1988-07' '1988-08'
 '1988-09' '1988-10' '1988-11' '1988-12' '1989-01' '1989-02' '1989-03'
 '1989-04' '1989-05' '1989-06' '1989-07' '1989-08' '1989-09' '1989-10'
 '1989-11' '1989-12' '1990-01' '1990-02' '1990-03' '1990-04' '1990-05'
 '1990-06' '1990-07' '1990-08' '1990-09' '1990-10' '1990-11' '1990-12'
 '1991-01' '1991-02' '1991-03' '1991-04' '1991-05' '1991-06' '1991-07'
 '1991-08' '1991-09' '1991-10' '1991-11' '1991-12' '1992-01' '1992-02'
 '1992-03' '1992-04' '1992-05' '1992-06' '1992-07' '1992-08' '1992-09'
 '1992-10' '1992-11' '1992-12' '1993-01' '1993-02' '1993-03' '1993-04'
 '1993-05' '1993-06' '1993-07' '1993-08' '1993-09' '1993-10' '1993-11'
 '1993-12' '1994-01' '1994-02' '1994-03' '1994-04' '1994-05' '1994-06'
 '1994-07' '1994-08' '1994-09' '1994-10' '1994-11' '1994-12' '1995-01'
 '1995-02' '1995-03' '1995-04' '1995-05' '1995-06' '1995-07' '1995-08'
 '1995-09' '1995-10' '1995-11' '1995-12' '1996-01' '1996-02' '1996-03'
 '1996-04' '1996-05' '1996-06' '1996-07' '1996-08' '1996-09' '1996-10'
 '1996-11' '1996-12' '1997-01' '1997-02' '1997-03' '1997-04' '1997-05'
 '1997-06' '1997-07' '1997-08' '1997-09' '1997-10' '1997-11' '1997-12'
 '1998-01' '1998-02' '1998-03' '1998-04' '1998-05' '1998-06' '1998-07'
 '1998-08' '1998-09' '1998-10' '1998-11' '1998-12' '1999-01' '1999-02'
 '1999-03' '1999-04' '1999-05' '1999-06' '1999-07' '1999-08' '1999-09'
 '1999-10' '1999-11' '1999-12' '2000-01' '2000-02' '2000-03' '2000-04'
 '2000-05' '2000-06' '2000-07' '2000-08' '2000-09' '2000-10' '2000-11'
 '2000-12' '2001-01' '2001-02' '2001-03' '2001-04' '2001-05' '2001-06'
 '2001-07' '2001-08' '2001-09' '2001-10' '2001-11' '2001-12' '2002-01'
 '2002-02' '2002-03' '2002-04' '2002-05' '2002-06' '2002-07' '2002-08'
 '2002-09' '2002-10' '2002-11' '2002-12' '2003-01' '2003-02' '2003-03'
 '2003-04' '2003-05' '2003-06' '2003-07' '2003-08' '2003-09' '2003-10'
 '2003-11' '2003-12' '2004-01' '2004-02' '2004-03' '2004-04' '2004-05'
 '2004-06' '2004-07' '2004-08' '2004-09' '2004-10' '2004-11' '2004-12'
 '2005-01' '2005-02' '2005-03' '2005-04' '2005-05' '2005-06' '2005-07'
 '2005-08' '2005-09' '2005-10' '2005-11' '2005-12' '2006-01' '2006-02'
 '2006-03' '2006-04' '2006-05' '2006-06' '2006-07' '2006-08' '2006-09'
 '2006-10' '2006-11' '2006-12' '2007-01' '2007-02' '2007-03' '2007-04'
 '2007-05' '2007-06' '2007-07' '2007-08' '2007-09' '2007-10' '2007-11'
 '2007-12' '2008-01' '2008-02' '2008-03' '2008-04' '2008-05' '2008-06'
 '2008-07' '2008-08' '2008-09' '2008-10' '2008-11' '2008-12' '2009-01'
 '2009-02' '2009-03' '2009-04' '2009-05' '2009-06' '2009-07' '2009-08'
 '2009-09' '2009-10' '2009-11' '2009-12' '2010-01' '2010-02' '2010-03'
 '2010-04' '2010-05' '2010-06' '2010-07' '2010-08' '2010-09' '2010-10'
 '2010-11' '2010-12' '2011-01' '2011-02' '2011-03' '2011-04' '2011-05'
 '2011-06' '2011-07' '2011-08' '2011-09' '2011-10' '2011-11' '2011-12'
 '2012-01' '2012-02' '2012-03' '2012-04' '2012-05' '2012-06' '2012-07'
 '2012-08' '2012-09' '2012-10' '2012-11' '2012-12' '2013-01' '2013-02'
 '2013-03' '2013-04' '2013-05' '2013-06' '2013-07' '2013-08' '2013-09'
 '2013-10' '2013-11' '2013-12' '2014-01' '2014-02' '2014-03' '2014-04'
 '2014-05' '2014-06' '2014-07' '2014-08' '2014-09' '2014-10' '2014-11'
 '2014-12' '2015-01' '2015-02' '2015-03' '2015-04' '2015-05' '2015-06'
 '2015-07' '2015-08' '2015-09' '2015-10' '2015-11' '2015-12' '2016-01'
 '2016-02' '2016-03' '2016-04' '2016-05' '2016-06' '2016-07' '2016-08'
 '2016-09' '2016-10' '2016-11' '2016-12' '2017-01' '2017-02' '2017-03'
 '2017-04' '2017-05' '2017-06' '2017-07' '2017-08' '2017-09' '2017-10'
 '2017-11' '2017-12' '2018-01' '2018-02' '2018-03' '2018-04' '2018-05'
 '2018-06' '2018-07' '2018-08' '2018-09' '2018-10' '2018-11' '2018-12'
 '2019-01' '2019-02' '2019-03' '2019-04' '2019-05' '2019-06' '2019-07'
 '2019-08' '2019-09' '2019-10' '2019-11' '2019-12' '2020-01' '2020-02'
 '2020-03' '2020-04' '2020-05' '2020-06' '2020-07' '2020-08' '2020-09'
 '2020-10' '2020-11' '2020-12' '2021-01' '2021-02' '2021-03' '2021-04'
 '2021-05' '2021-06' '2021-07' '2021-08' '2021-09' '2021-10' '2021-11'
 '2021-12' '2022-01' '2022-02' '2022-03' '2022-04' '2022-05' '2022-06'
 '2022-07' '2022-08' '2022-09' '2022-10' '2022-11' '2022-12']
You should see an array of dates printed to the screen.
Now, let’s plot sea ice extent as a function of time. Try it on your own and make a simple time series plot.
Show code cell source
# Make a simple line plot
plt.plot(time,SIE)
Show code cell output
[<matplotlib.lines.Line2D at 0x113b95a80>]

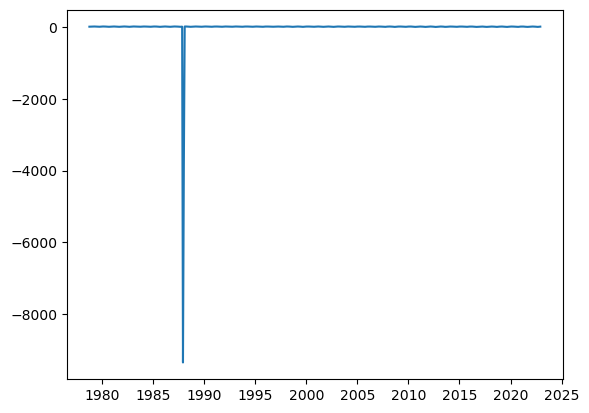
What happened? Are you getting weird and unphysical results?
Sometimes missing data is identified with large (positive or negative) integers. This is exactly what is happening with this data set - missing data are flagged with a -9999 value. Try to use a masked array to deal with this issue. You might have to google masked arrays to find the right function.
Show code cell source
# mask values that are less than zero (negative values are unphysical)
SIE = np.ma.masked_less(SIE,0.0)
We can now plot our masked sea ice extent as a function of time.
# Plot sea ice extent (SIE) time series
plt.figure(figsize=(8,6))

# change font size
plt.rcParams.update({'font.size': 14})

# plot data
plt.plot(time,SIE,'gray')

# title, labels, etc.
plt.xlabel('time')
plt.ylabel('SIE (10$^6$ km$^2$)')
plt.title('Arctic Sea Ice Extent')
Text(0.5, 1.0, 'Arctic Sea Ice Extent')

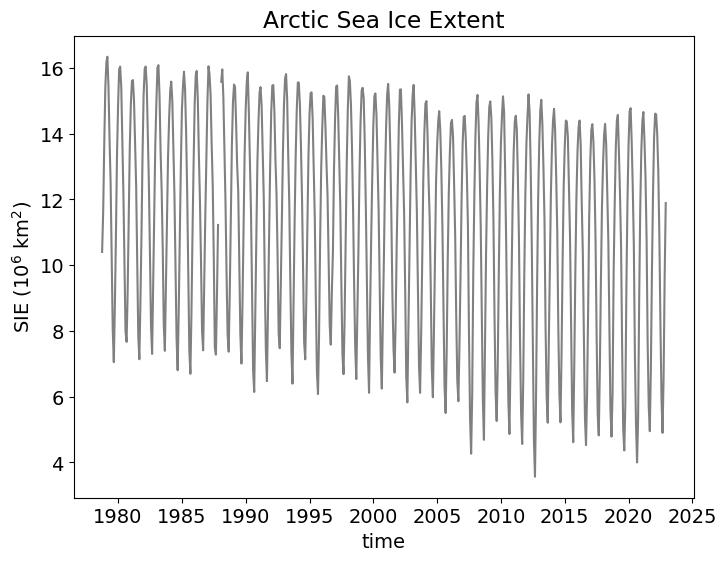
You can see a gap in the data where the missing data is masked.
Does this plot make physical sense? Consider the seasonal cycle of Arctic sea ice and the long-term trend.
Trend Analysis#
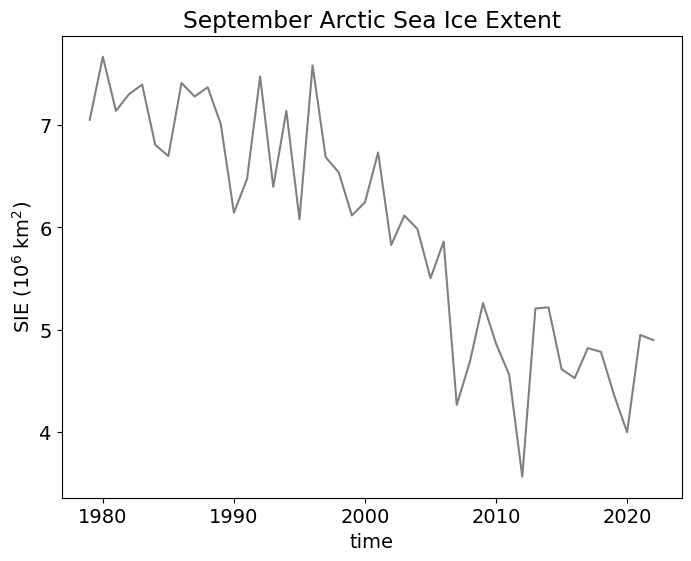
One of the key indicators of climate change is Arctic sea ice loss. Typically, Arctic sea ice extent in September is used to show the dramatic loss of sea ice, as September is the month when the sea ice extent is at its minimum.
Use a loop and a conditional to extract the September data.
Show code cell source
# loop and conditional to extract September data
SIE_sept = []
for i in range(len(SIE)):
    if month[i] == 9:
        SIE_sept.append(SIE[i]) # I chose to use a list because I didn't know a priori how many elements I would get
Show code cell source
# Here is an alternative way to do the above without a loop (there are so many cool short-cuts!)
SIE_sept = SIE[month == 9]
Once you have only September data, make a time series plot of September Arctic SIE. You will need to define a new x-coordinate.
Show code cell source
# define years with September data
year_sept = year[month == 9]

# Plot sea ice extent (SIE) time series
plt.figure(figsize=(8,6))

# change font size
plt.rcParams.update({'font.size': 14})

plt.plot(year_sept,SIE_sept,'gray')

# title, labels, etc.
plt.xlabel('time')
plt.ylabel('SIE (10$^6$ km$^2$)')
plt.title('September Arctic Sea Ice Extent')
Show code cell output
Text(0.5, 1.0, 'September Arctic Sea Ice Extent')

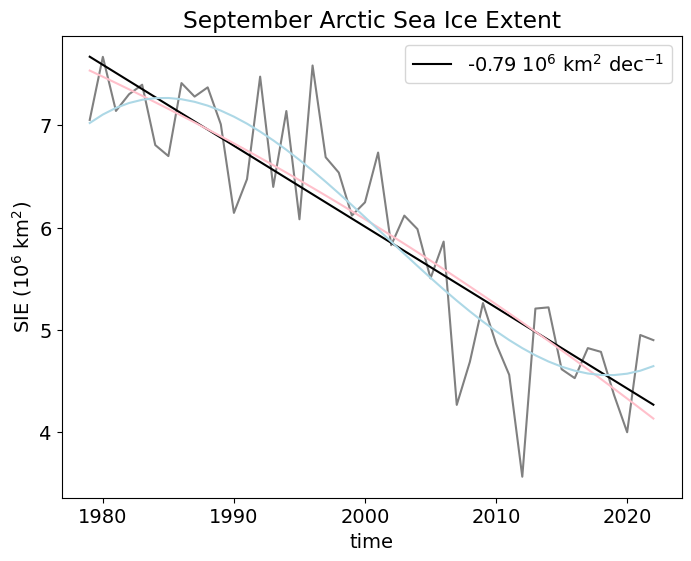
Now, let’s use the np.polyfit() and np.polyval() functions again and this time we will test out different polynomial fits. Try n = 1, 2 and 3 and add all of the fits to the plot above. Also add the slope of the n = 1 line in the legend in units of 10\(^6\) km\(^2\) per decade.
Show code cell source
# polynomial fits

# n = 1
a1 = np.polyfit(year_sept,SIE_sept,1)
SIE_sept_n1 = np.polyval(a1,year_sept)

# n = 2
a2 = np.polyfit(year_sept,SIE_sept,2)
SIE_sept_n2 = np.polyval(a2,year_sept)

# n = 3
a3 = np.polyfit(year_sept,SIE_sept,3)
SIE_sept_n3 = np.polyval(a3,year_sept)
Show code cell source
# Plot sea ice extent (SIE) time series
plt.figure(figsize=(8,6))

# change font size
plt.rcParams.update({'font.size': 14})

plt.plot(year_sept,SIE_sept,'gray')
plt.plot(year_sept,SIE_sept_n1,'k',label=str(np.round(10*a1[0],2))+ " 10$^6$ km$^2$ dec$^{-1}$")
plt.plot(year_sept,SIE_sept_n2,color ='pink')
plt.plot(year_sept,SIE_sept_n3,color='lightblue')

# title, labels, etc.
plt.xlabel('time')
plt.ylabel('SIE (10$^6$ km$^2$)')
plt.title('September Arctic Sea Ice Extent')
plt.legend(loc='upper right')
Show code cell output
<matplotlib.legend.Legend at 0x113f0e380>

To get EES1100H short course credit, please attempt the following additional exercises:
plot the time series of March Arctic SIE (save this plot as a .png file for upload using
plt.savefig()(you may need to Google this function). Compare the magnitude of the trends in March (the Arctic SIE maximum) and September.calculate the R-squared for the March and September trends (refer to the pervious exercise using the Argo data).
compute the climatological (i.e., average over all years) seasonal cycle of SIE and plot it. This is a plot of SIE as a function of month and each month represents the mean over all years. (Hint: Remove the year 1978 by using slicing (this is not a complete year) and then use
np.reshape()to create an array for SIE with two dimensions: (year,month). Next, calculate the mean over the appropriate dimension usingnp.mean(...,axis=...). Finally, plot the climatological mean SIE as a function of month. We looked at examples of the reshape function in Module 2, Exercises: Part I. Here is an example of what this plot should roughly look like (but only one curve).

