
Lies, damned lies and statistics…#
As we have seen, statistics are an invaluable way to support hypotheses, inform scientific experimental design and extract signal from noisy data. Yet, statistics can often be misused. Here is what statistics are not good for:
Replacing good scientific thinking
statistics cannot “prove” anything and all statistical tests have a chance of being wrong.
Fishing for a desired result
performing statistical analysis means carefully considering the right tools to use for each unique situation.
Making-up for a lack of data
statistical analysis cannot replace sufficient, high-quality data.
A Few Common Pitfalls#
Here are a few common analysis errors to watch out for (in your own work as well as the work of others):
Meaningless statistics#
e.g. daily rainfall or earthquake magnitude data is much more appropriately described using the median rather than the mean, but if you don’t look at your data and you are not familiar with the nature of your data, you might find yourself computing inappropriate statistics.
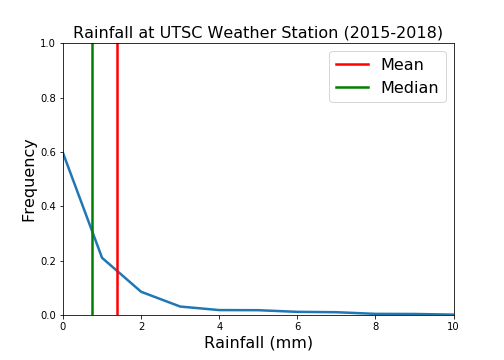
Fig. 2 Non-zero Hourly Rainfall at UTSC Weather Station#
Small sample sizes#
sometimes you simply do not have enough data to perform any analysis.
Biased data#
sometimes you do have enough data, but the data is biased. Explore potential biases, acknowledge these biases and avoid generalizing your results if you know your data is biased.
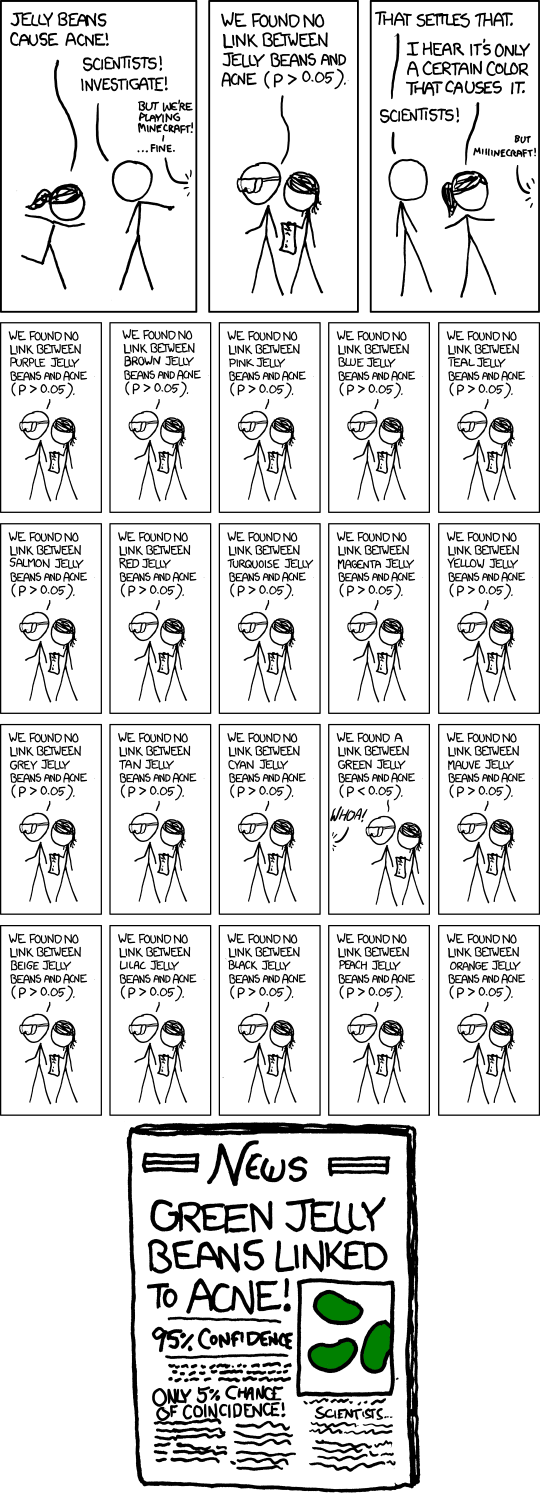
Data mining#
a large data set might show that there is a statistically significant probability that \(X\) is related to \(Y\) if you look long enough.
Spurious correlation#
correlation does not imply causation. Interpretation must always be grounded in theory (Fig. 4).
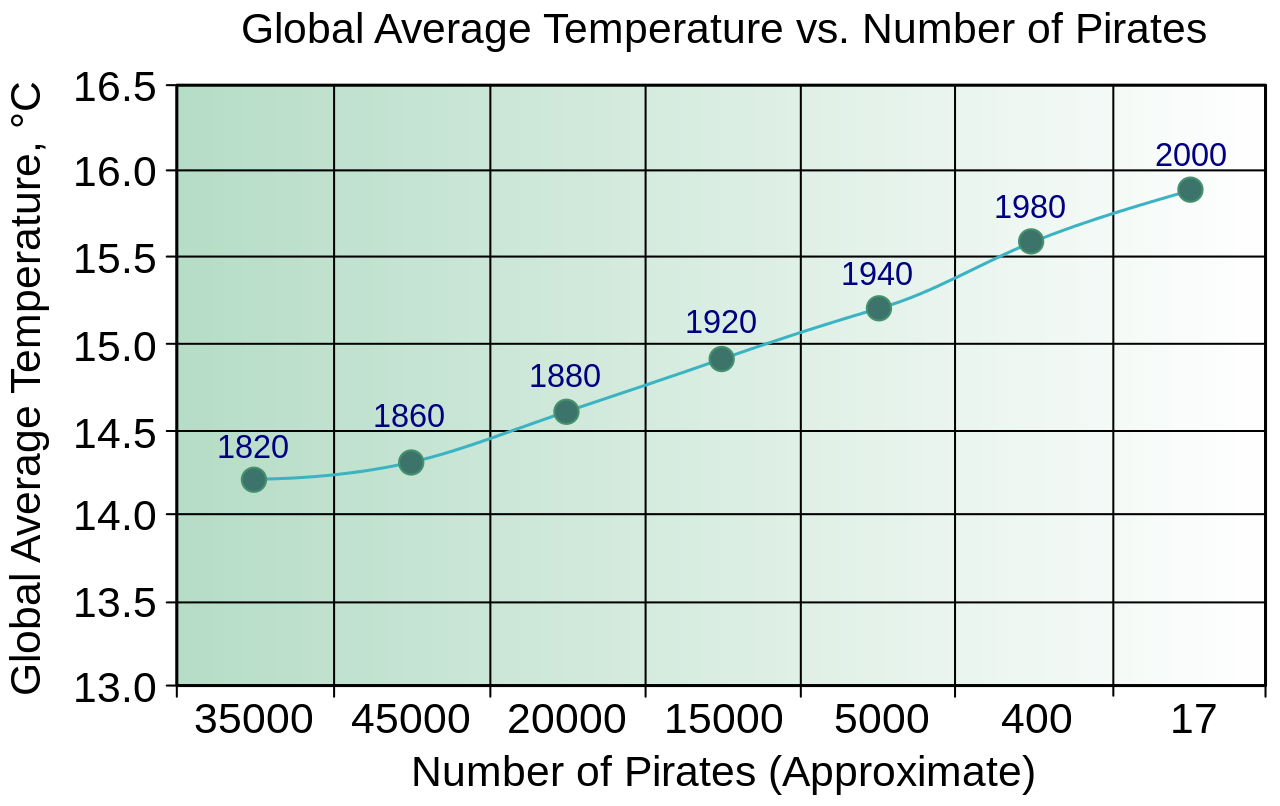
Fig. 4 Stop global warming, become a pirate! image source here#
.svg)
Plots that mislead#
be mindful that we humans make quantitative assumptions based on how data is presented. Be objective in your data presentation. Read more about how the choice of colour is so important, especially for those with red-green colour-blindness.