
The z-Statistic#
Rather than referring to diagrams of the standard normal distribution to assess probabilities of \(z\), the typical thing to do in statistics courses is to use \(z\)-tables.
We will take a look at how to use tables, but we will also use python functions.
The following link contains a \(z\)-table (as well as other tables), and it is also shown in Figure 8.
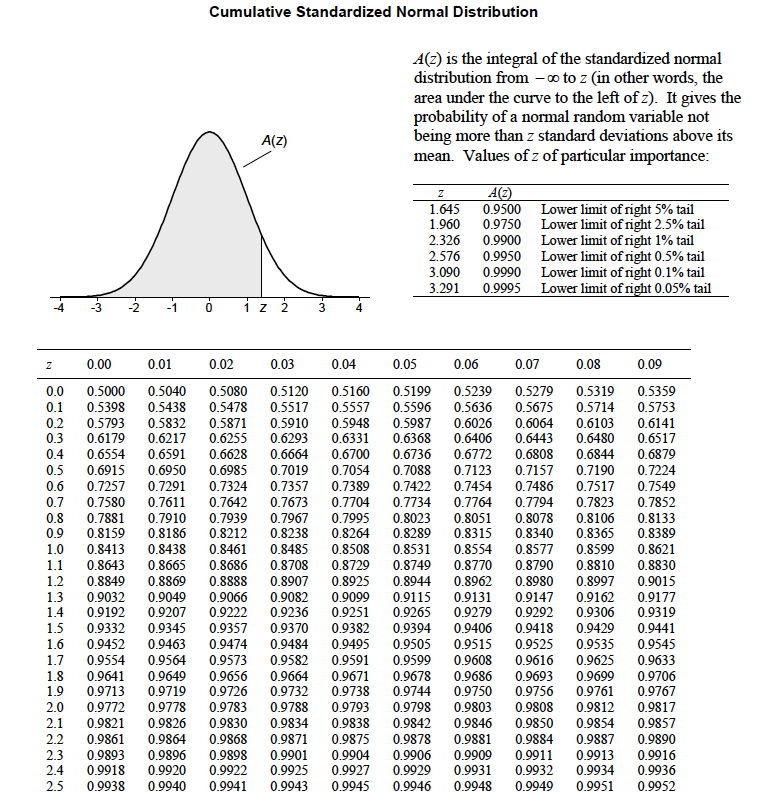
Fig. 8 z-Table. Table entries for \(z\) represent the area under the curve to the left of \(z\). Only positive values for \(z\) are shown. (from C. Dougherty Introduction to Econometrics second edition 2002, Oxford University Press, Oxford.)#
Let’s learn how to read this table using a few examples.
z-Statistic Examples#
Assume that you have 50 years of monthly El-Niño Southern Oscillation (ENSO) indices (\(Z\)), and that the index is well approximated by a standard normal distribution:
Question #1
Using the table, what is the probability that a randomly chosen month has an ENSO index of exactly +2?
Before you go to the table, re-read this question. What are the chances that a continuous variable, like the ENSO index, has a value of exactly +2? This is a trick question. In this case, the probability is zero.
Question #2
Using the table, what is the probability that a randomly chosen month has an ENSO index of +2.05 or less?
Looking at the \(z\)-table in Figure 8, we go to the left-most column and look for a value of 2.0. We can use the other columns to add the appropriate hundredths to our value of 2.0. We want to add 0.05 to get 2.05, so we look-up the probability under the column labelled 0.05. What do you get?
You should get a value of 0.9798. This means that there is a 97.98% probability that a randomly chosen month has an ENSO index of +2.05 or less.
Let’s try another one.
Question #3
Using the table, what is the probability that a randomly chosen month has an ENSO index of +2.05 or greater?
This one is a bit trickier. The \(z\)-table we are using shows us the area under the curve left of \(z\), but we actually want to know the area right of \(z\). The key is that we know the total area under this curve is 1. So, the probability that a randomly chosen month has an ENSO index of +2.05 or greater is simply 1 - 0.9798 = 0.0202.
Now, let’s try these same two examples with python.
# To look up this the probability of a certain z-score in python, we use the scipy.stats norm.cdf() function
import scipy.stats as st

#Example #2
p = st.norm.cdf(2.05)
print(round(p,4)) # here, I'm rounding to the same number of decimal places as the table.
0.9798
We should get the same answer that we got with the table, and we do.
#Example #3
p = 1- st.norm.cdf(2.05)
print(round(p,4))
0.0202
Great! Everything checks out.
Here are a few more for you to try with the table first and then check with python.
Question #4
What is the probability the ENSO index is 1.23 or smaller?
#Example #4
p = st.norm.cdf(1.23)
print(round(p,4))
Show code cell output
0.8907
Question #5
What is the probability the ENSO index is 1.23 or greater?
#Example #5
p = 1-st.norm.cdf(1.23)
print(round(p,4))
Show code cell output
0.1093
Question #6
What is the probability the ENSO index is greater than +1 and less than +2?
Show code cell source
#Example #6
p = st.norm.cdf(2) - st.norm.cdf(1)
print(round(p,4))
Show code cell output
0.1359
We can also use the \(z\)-table in reverse, i.e., if we know the probability of an event, we can find the \(z\)-score. Using the same ENSO index as above:
Question #7
What ENSO index \(\epsilon\) gives \(Pr\)(\(z\) \(\leq\) \(\epsilon\)) = 0.9?
The formulation of this problem corresponds to the structure of our \(z\)-table which shows the area under the curve to the left (\(\leq\)) of \(z\). Looking at the table, we look for the value 0.9. We don’t see an exact value for 0.9, but we can interpolate. \(\epsilon\) in about 1.282.
Let’s check this with python.
# To look up this the z-score for a certain probability in python, we use the scipy.stats norm.ppf() function

# Example #7
z = st.norm.ppf(0.9)
print(round(z,3))
1.282
Now, you can try the rest on your own. Open up a blank notebook to try it out before you check the answer.
Question #8
What ENSO index \(\epsilon\) gives \(Pr\)(\(z\) \(\geq\) \(\epsilon\)) = 0.1?
Show code cell source
# Example #2
z = -st.norm.ppf(0.1)
print(round(z,3))
Show code cell output
1.282
Question #9
What ENSO index \(\epsilon\) gives \(Pr\)(\(z\) \(\leq\) \(\epsilon\)) = 0.1?
Show code cell source
# Example #3
z = st.norm.ppf(0.1)
print(round(z,3))
Show code cell output
-1.282
Question #10
What ENSO index \(\epsilon\) gives \(Pr\)(|\(z\)| \(\geq\) \(\epsilon\)) = 0.1? (Note: |\(z\)| \(\geq\) \(\epsilon\) is the same as \(z\) \(\leq\) -\(\epsilon\) and \(z\) \(\geq\) \(\epsilon\))
Show code cell source
# Example #3
z1 = st.norm.ppf(0.05)
z2 = st.norm.ppf(0.95)
print(round(z1,3),round(z2,3))
Show code cell output
-1.645 1.645