Time Series Analysis#
Broadly speaking, time series analysis is used to describe the time scales of variation in the data and to identify the time scales that account for the largest contribution to the variance. For example, a long-term trend might account for the majority of the variability in a given time series or the seasonal cycle might be the largest source of variability in a different time series.
A key concept in time series analysis is filtering. Filtering is a technique that can be used to remove high frequency noise or low frequency variability from time series and isolate the frequencies of interest.
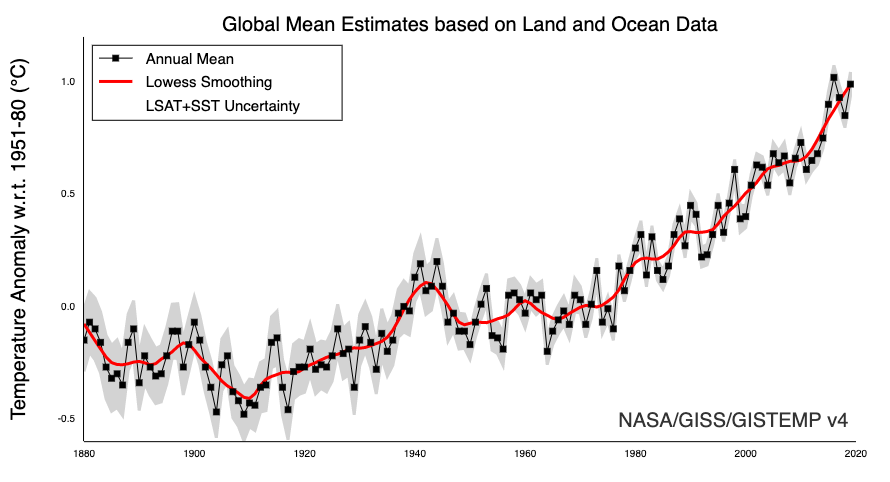
low-pass filtering: retains only the low-frequency variability (aka “smoothing”, see Figure 17)
high-pass filtering: retains only high-frequency variability
band-pass filtering: retains a “band” of frequencies

Fig. 17 Globally averaged surface air temperature time series (GISTEMP) at annual temporal resolution (black curve). The red curve shows the low-pass filtered time series using Lowess smoothing.#
Filtering is a technique that is used for various reasons. One common reason to use filtering is that your original time series is autocorrelated and you want to remove the source of autocorrelation (e.g. a trend, a seasonal or diurnal cycle, etc.). Another reason might be that you are only interested in a certain characteristic of a time series and you want to isolate the relevant frequencies (e.g. ENSO)
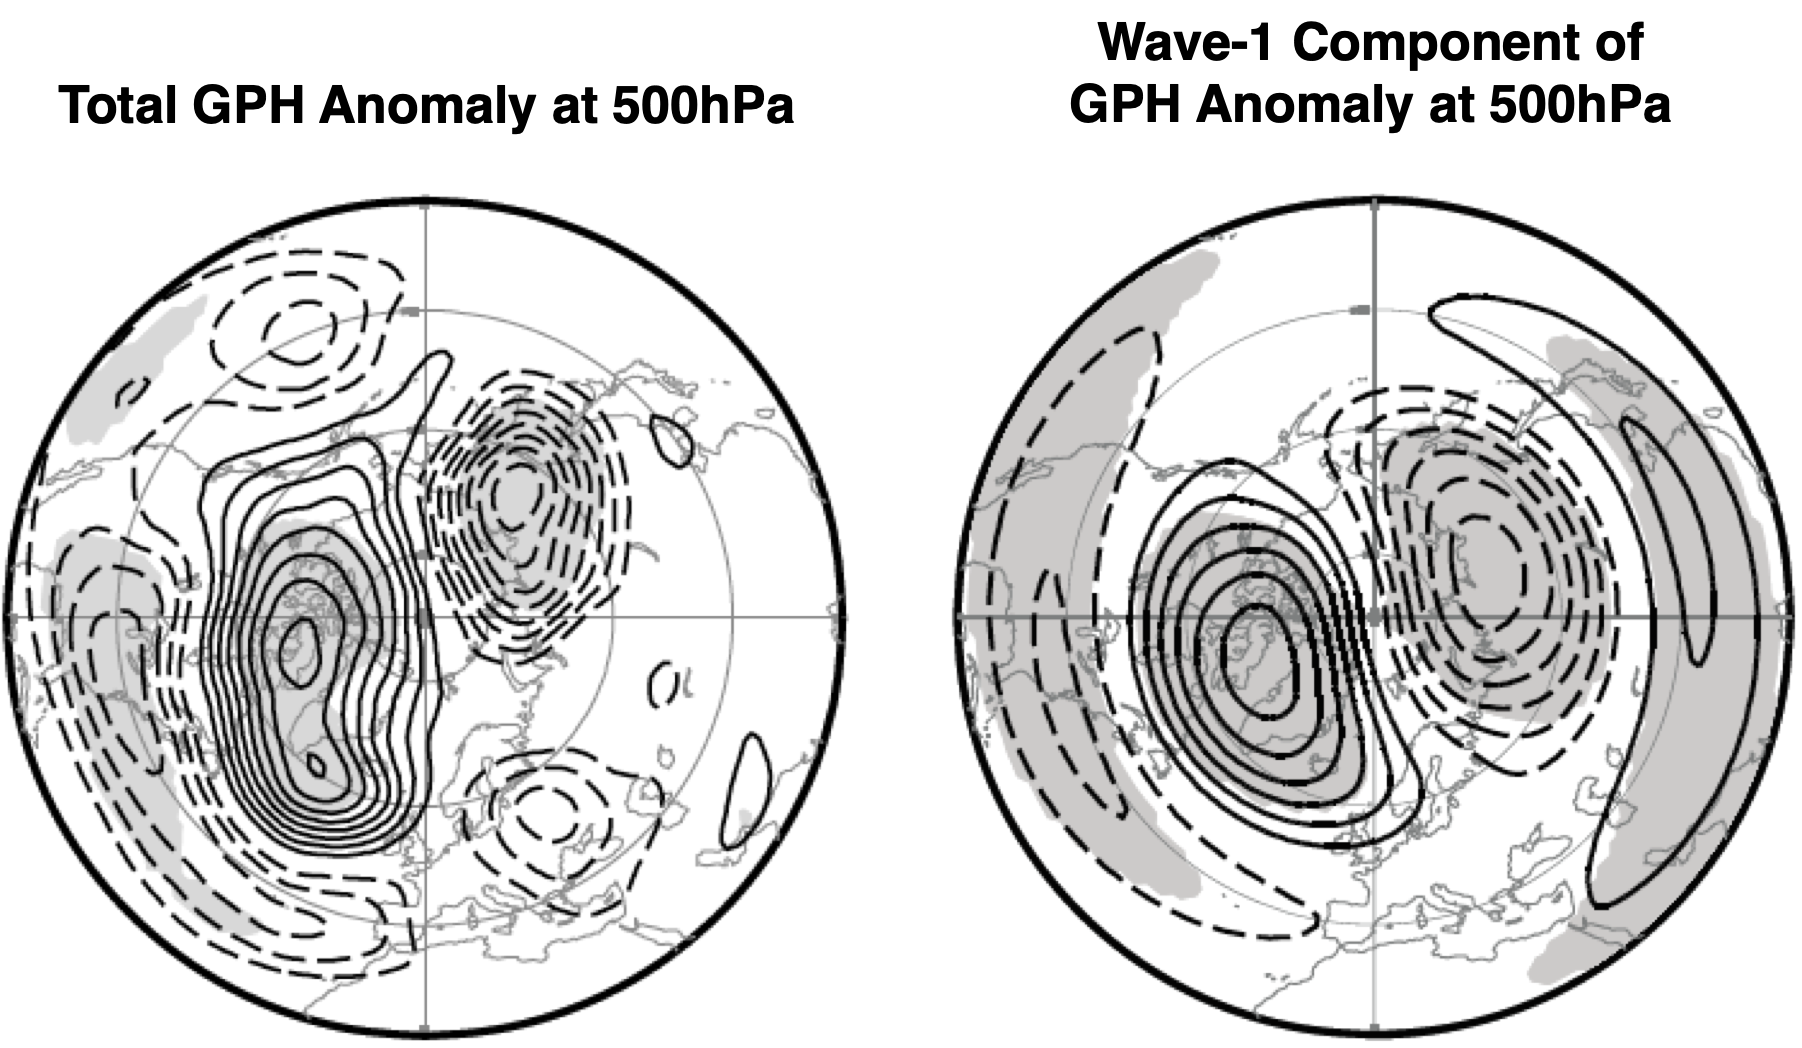
Here, we will focus on filtering in the time/frequency domain, but you can also filter in the space/wavenumber domain (Figure 18).

Fig. 18 Geopotential height (GPH) anomaly at 500hPa (left) and the corresponding wavenumber 1 component (right) (from Dunn-Sigouin and Shaw, 2015). The positive and negative regions of GPH represent atmospheric highs and lows. Notice that the large-scale features are similar in the two maps, but the wave-number 1 component is less noisy.#
To familiarize ourselves with the concept of filtering, we will start by examining some simple techniques to filter a time series in the time domain. We will then move onto spectral analysis and filtering in the frequency domain.
